Sertai Cabaran PU Xtrader Hari Ini
Berjual beli dengan modal simulasi dan peroleh keuntungan sebenar selepas anda lulus penilaian pedagang kami.
Sertai Cabaran PU Xtrader Hari Ini
Berjual beli dengan modal simulasi dan peroleh keuntungan sebenar selepas anda lulus penilaian pedagang kami.

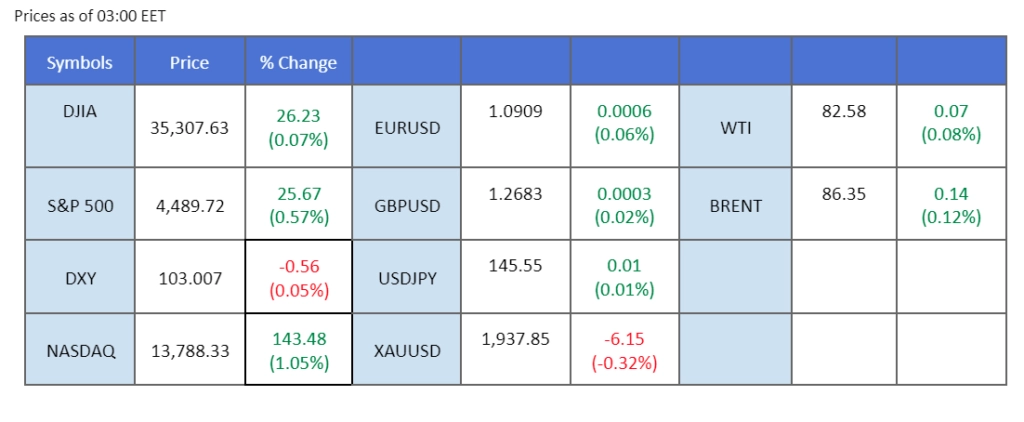
China has taken an unexpected decision to reduce its interest rate as a measure to invigorate its persistently subdued economy. The action, carried out by the People’s Bank of China, has sparked apprehensions within the market regarding the ongoing deterioration of the economic prospects for China. In parallel, the bleak economic outlook for China has exerted a dampening effect on the upward momentum of oil prices. Additionally, the U.S. economy exhibited higher-than-anticipated Producer Price Index (PPI) figures for July, reinforcing yields in the U.S. Treasury market and propelling the dollar to surpass the $103 threshold in recent trading sessions. Concurrently, the price of gold experienced a decline and is now nearing a significant psychological support level at $1900.
Current rate hike bets on 20th September Fed interest rate decision:
Source: CME Fedwatch Tool
0 bps (86%) VS 25 bps (14%)


The greenback soared to a more than one-month high, propelled by investors seeking refuge in the safe-haven US Dollar due to mounting apprehensions surrounding China’s economic stability. This flight to safety was further accentuated by a surge in US Treasury yields, reaching a notable nine-month pinnacle. All eyes are fixated on the impending US retail sales data, due to be released later today. Projections point to a 0.40% uptick in consumer spending, underscoring the resilience of the US economy. In parallel, market participants are eagerly awaiting insights from the upcoming Federal Open Market Committee (FOMC) meeting, a pivotal event in this week’s financial landscape.
The dollar index is trading higher while currently testing the resistance level. However, MACD has illustrated diminishing bullish momentum, while RSI is at 65, suggesting the index might enter oversold territory.
Resistance level: 103.40, 103.90
Support level: 102.60, 101.95
The allure of gold as a safe-haven asset wanes as US Treasury yields maintain their upward trajectory, reinforcing a prevailing shift towards a more hawkish stance among investors. The forthcoming US Retail Sales and FOMC meeting minutes are poised to provide further guidance on this evolving sentiment.
Gold prices are trading lower while currently testing the support level. However, MACD has illustrated diminishing bearish momentum, while RSI is at 37, suggesting the commodity might trade higher as technical correction since the RSI rebounded sharply from oversold territory.
Resistance level: 1930.00, 1945.00
Support level: 1905.00, 1885.00
The Japanese yen has descended to its lowest levels since November, as the Bank of Japan’s ultra-loose monetary policy diverges from strategies pursued by other prominent global central banks. This has precipitated a discernible expansion in the yield spread between Japan and other major economies, prompting speculation about potential currency intervention by the Bank of Japan as the yen approaches a critical threshold. A historical precedent in September, where such intervention occurred at a similar price range, underscores the significance of this impending decision.
USD/JPY is trading higher following the prior breakout above the previous resistance level. However, MACD has illustrated diminishing bullish momentum, while RSI is at 77, suggesting the pair might enter oversold territory
Resistance level: 146.00, 147.25
Support level: 144.75, 143.25
The strengthening dollar has exerted downward pressure on the euro, causing it to reach its lowest point since the beginning of July. The below-par economic performance in China has contributed to maintaining elevated U.S. Treasury yields. Notably, the Dollar Index has surpassed the $103.00 threshold, resulting in a notable decline in the EUR/USD pair. Concurrently, market participants are anticipating the release of the Eurozone GDP figures scheduled for Wednesday. This data release holds significance in assessing the region’s overall economic health and provides insight into the strength of the euro.
Euro failed to trade above its crucial support level at 1.0930, suggesting a bearish bias for the pair. The RSI is approaching the oversold zone while the MACD continues to slide, signalling a strong bearish momentum intact with the pair as well.
Resistance level: 1.0930, 1.0999
Support level: 1.0850, 1.0762
In spite of the dollar’s recent surge in strength, the Cable has displayed a notable degree of stability in anticipation of significant economic data releases scheduled for today. Notably, the UK’s average earnings index is projected to advance from its previous reading of 6.9% to 7.3%. This potential increase could amplify inflationary concerns within the country. Conversely, the unemployment rate is anticipated to remain unchanged. Simultaneously, attention is focused on the forthcoming U.S. retail sales data, also set to be released today. The outcome of this data release is expected to wield a pivotal influence on the dollar’s strength, while concurrently shaping the trajectory of the Cable’s price movement.
GBP/USD is trading near its short-term support level at 1.2670 while waiting for a catalyst to rebound. The indicators have given neutral signals for the pair as the RSI and the MACD both move flat.
Resistance level: 1.2740, 1.2860
Support level: 1.2605, 1.2500
The Chinese stock market has exhibited a sluggish performance in recent times, mirroring the disappointing economic data which revealed that the country’s economy has fallen short of expectations. This includes both the PMI (Purchasing Managers’ Index) reading and the CPI (Consumer Price Index) reading. Adding to this, the unexpected decision by the People’s Bank of China to lower the country’s interest rate has prompted the market to adopt a more pessimistic stance regarding the nation’s economic prospects. As a result, there has been heightened volatility in Chinese stocks, contributing to a decline in the Hong Kong stock market as well.
The Hang Seng index has plunged by more than 2% this week and is approaching its crucial support level at around 18350. The RSI is on the brink of breaking into the oversold zone while the MACD has broken below the zero line suggesting the index is trading with a strong bearish momentum.
Resistance level: 19130.00, 19860.00
Support level: 18350.00, 17550.00
Amid worries of potential contagion, China’s economy faces uncertainty. After the recent property crisis and declining property values, another failing fund management company could compound the unease. This pessimistic economic outlook is casting a shadow over Chinese-proxy currencies, like the Aussie Dollar, which continue to experience losses, reflecting investor concerns.
AUD/USD is trading lower while currently testing thes support level. However, MACD has illustrated diminishing bearish momentum, while RSI is at 41, suggesting the pair might be traded higher as technical correction since the RSI rebounded sharply from oversold territory.
Resistance level: 0.6600, 0.6695
Support level: 0.6465, 0.6395
The oil market extended its decline, grappling with concerns over China’s faltering economic revival and the concurrent strength of the US Dollar. Mounting apprehensions about China’s shadow banking industry, exemplified by the predicament at Zhongzhi Enterprise Group Co., have instigated fresh unease regarding potential contagion effects and their ramifications for China’s economic panorama.
Oil prices are trading lower following the prior retracement from the resistance level. MACD has illustrated increasing bearish momentum, while RSI is at 46, suggesting the commodity might extend its losses toward support level since the RSI stays below the midline.
Resistance level: 83.25, 87.25
Support level: 79.90, 76.90

Trade forex, indices, cryptocurrencies, and more at industry-low spreads and lightning-fast execution.

12 December 2023, 05:38 All Eyes On U.S. CPI Reading

11 December 2023, 05:23 Dollar Surges On Exceptional Jobs Data

8 December 2023, 05:50 Yen Rallies On BoJ Hawkish Comment

Pendaftaran Baru Tidak Tersedia
Kami tidak menerima pendaftaran baru buat masa ini.
Walaupun pendaftaran baru tidak tersedia, pengguna sedia ada boleh meneruskan cabaran dan aktiviti perdagangan seperti biasa.